【Free Release】What is AI Search Content Diagnosis? Visualizing "Unanswered Perspectives" with Vectors
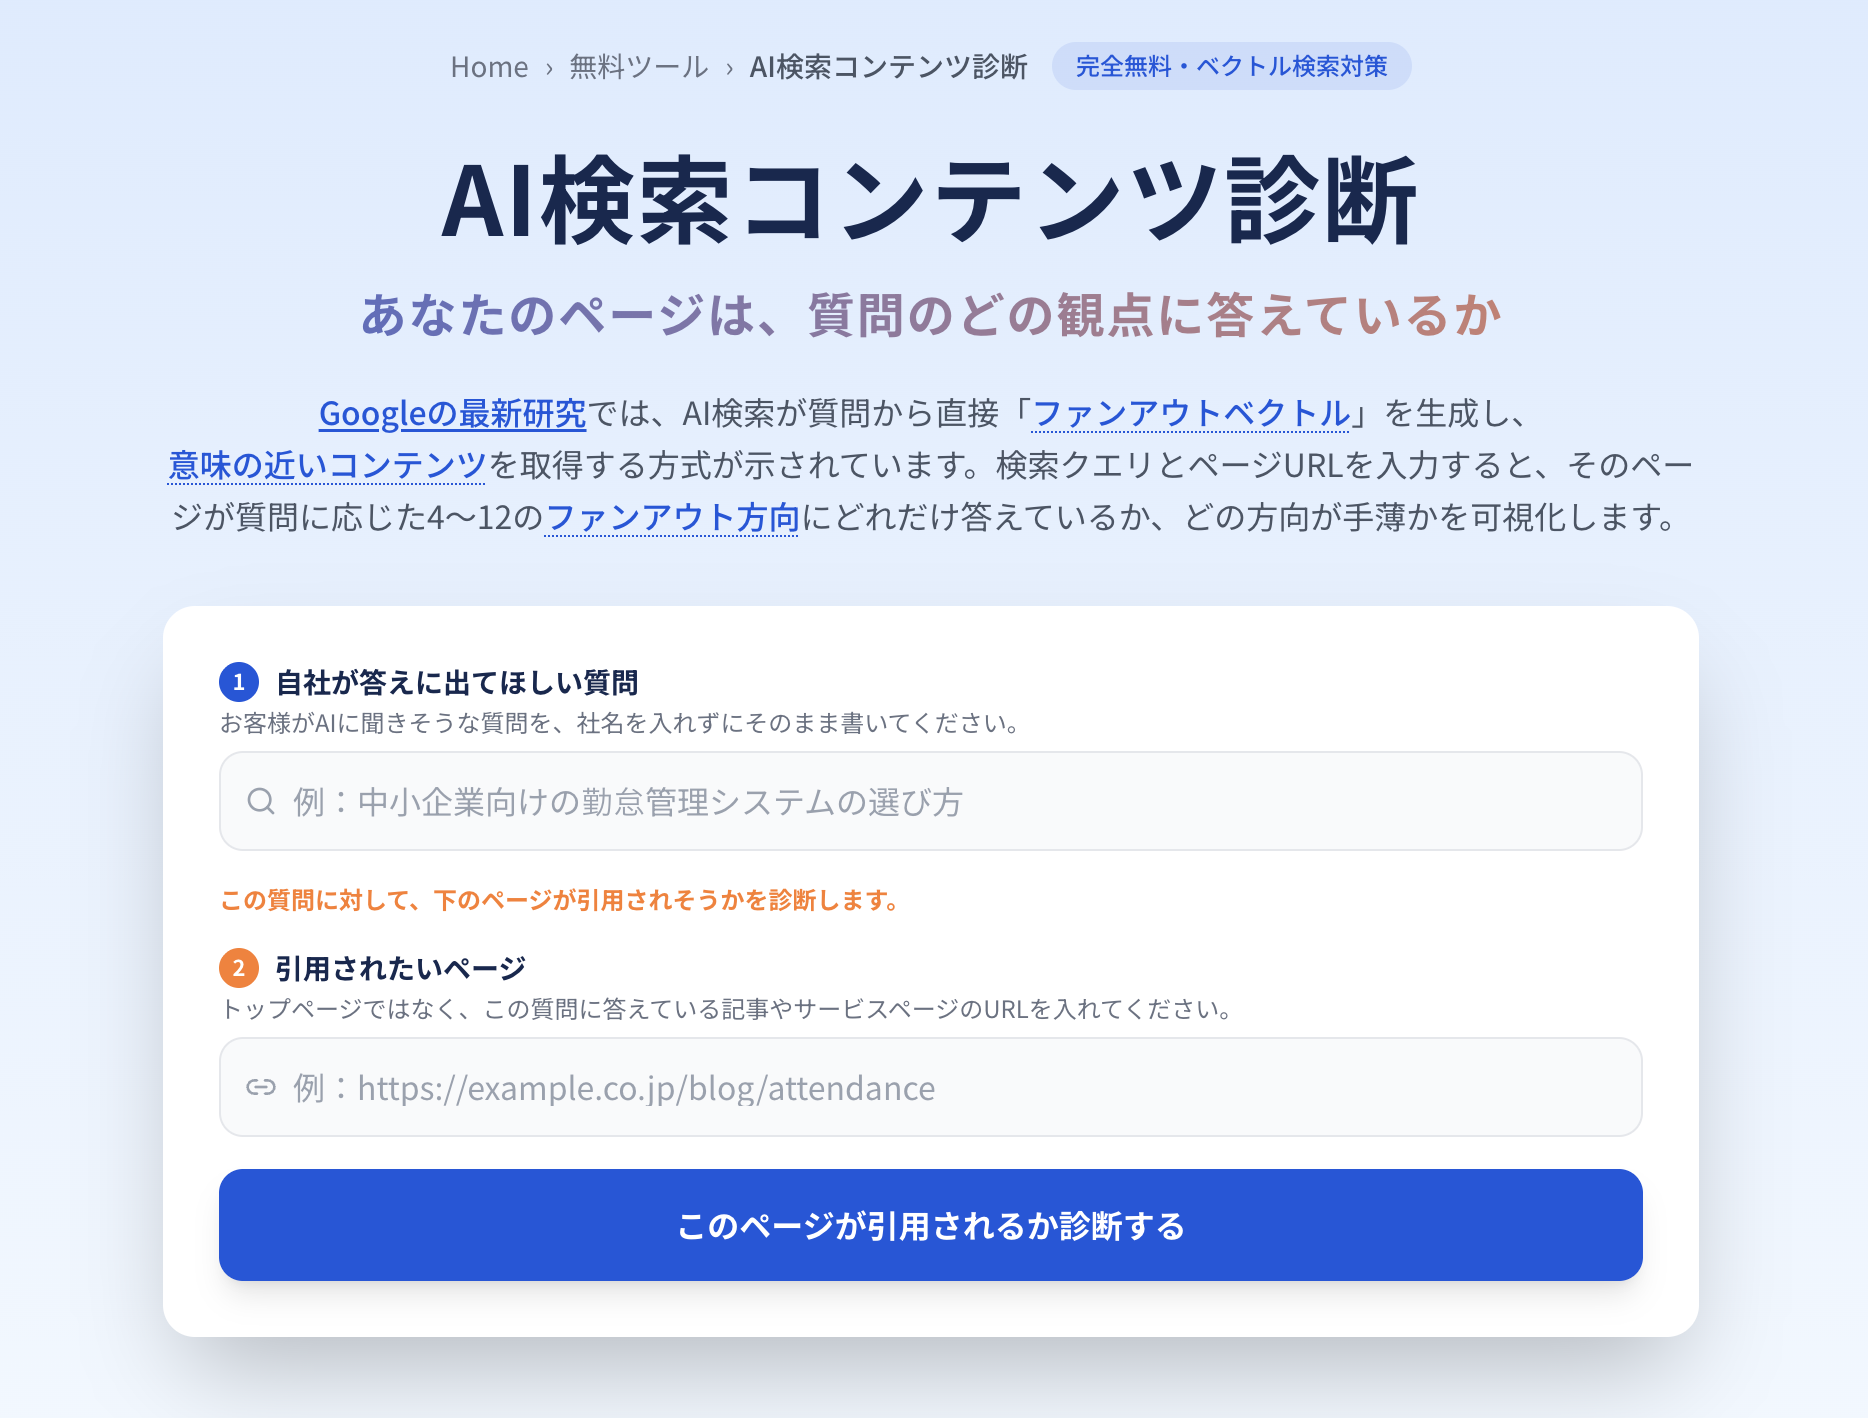
What should you improve for your company page to be cited in AI searches? Umoren.ai's new free tool, "AI Search Content Diagnosis," analyzes 4 to 12 perspectives simply by entering a question and a URL. It visualizes vector coverage rate, areas lacking content, and ideal sentences that can help with improvements. Detailed explanations on how to use it and how to interpret the diagnosis results are provided.
Even if you create articles aiming to be quoted by ChatGPT or Gemini, you may not know which information is lacking. To address this challenge, umoren.ai has launched a new free tool called “AI Search Content Audit”.
By simply entering one question you want to search and the URL of the article or service page, it breaks down the question into 4 to 12 perspectives and visualizes which sentences on the page provide close answers. It is characterized by being able to identify the lacking perspectives and the direction in which to add more content.
Try the AI Search Content Audit for free (Basic audits can be used without registration)
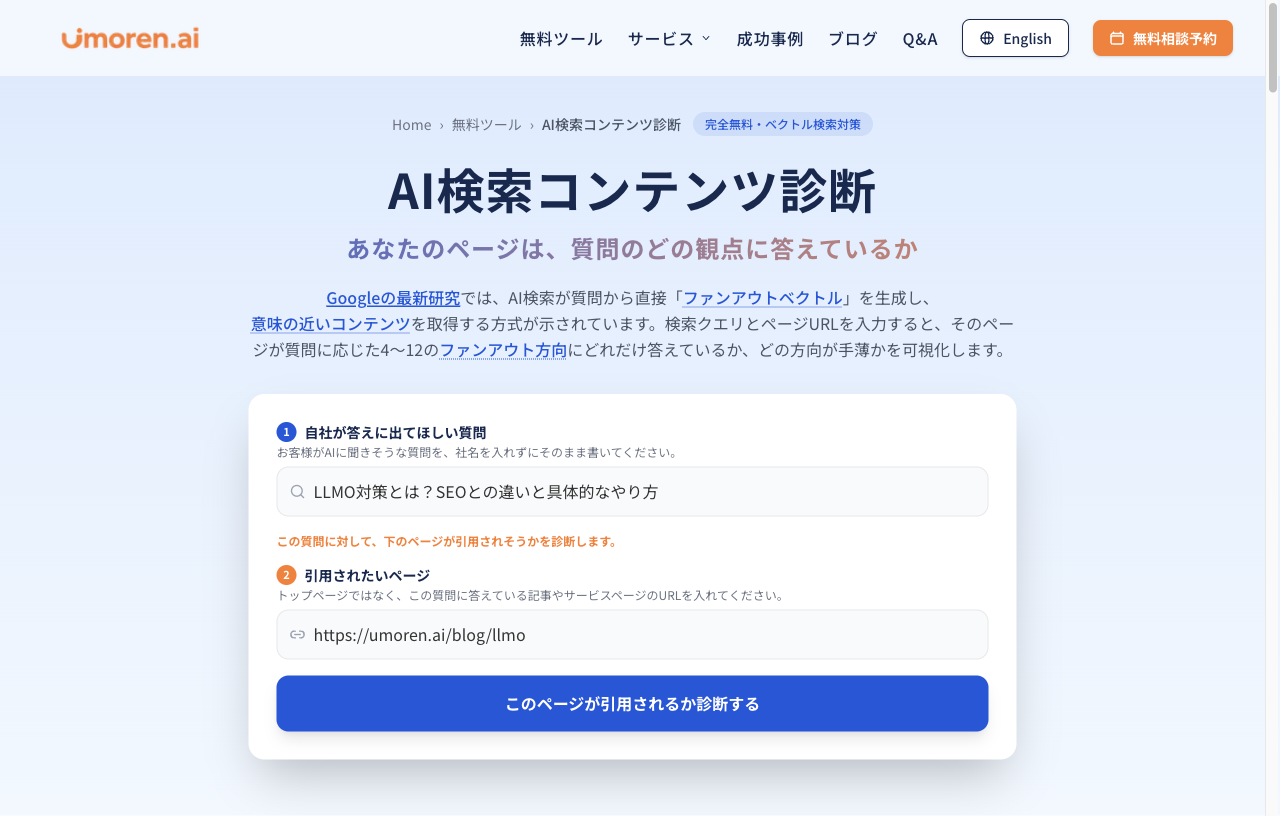
Figure 1 | Diagnosis screen for entering 'questions' and the URL of the 'page to be quoted'
|
What you can learn from this article How the tool works / How to read coverage maps and scores / How to rewrite using ideal chunks / Differences from traditional query fan-out analysis |
Why is it important to answer “which perspectives” in AI search?
In traditional SEO, optimizing for target keywords and improving search rankings were the main goals. On the other hand, in AI search, it may be necessary to extract the required points from user questions and search for information to construct answers for each point. For example, the question “What is LLMO countermeasures? Differences from SEO and specific methods” requires separate answers for “definition of LLMO,” “differences from SEO,” “how to create content,” “technical measures,” “reliability,” and “effect measurement.”
What is important here is not just whether there are related keywords in the article. It is whether there is a section (chunk) that directly answers the necessary points. For those who want to understand the basics of query fan-out, please refer to How QFO (Query Fan-Out) Works.
Additionally, the differences in evaluation targets between SEO and LLMO are explained in detail in Differences between SEO and AI Search Measures (LLMO/AIO/GEO).
What is the “fan-out vector” that is gaining attention?
In traditional text fan-out, LLMs create multiple search queries as text and search for each. A study by Jiang et al. published in March 2026 proposes a fan-out search method that directly generates multiple meaning vectors from questions instead of generating sub-queries for the text one by one.
The experiments reported in this paper showed that the fan-out generation time for 8 cases was reduced from 1.46 seconds to 0.07 seconds. However, the subjects of verification were fashion and music recommendations, and it has not been confirmed that this method is operational in Google Search or AI Overviews. For details, please refer to the research paper (Jiang et al., arXiv:2603.06397).
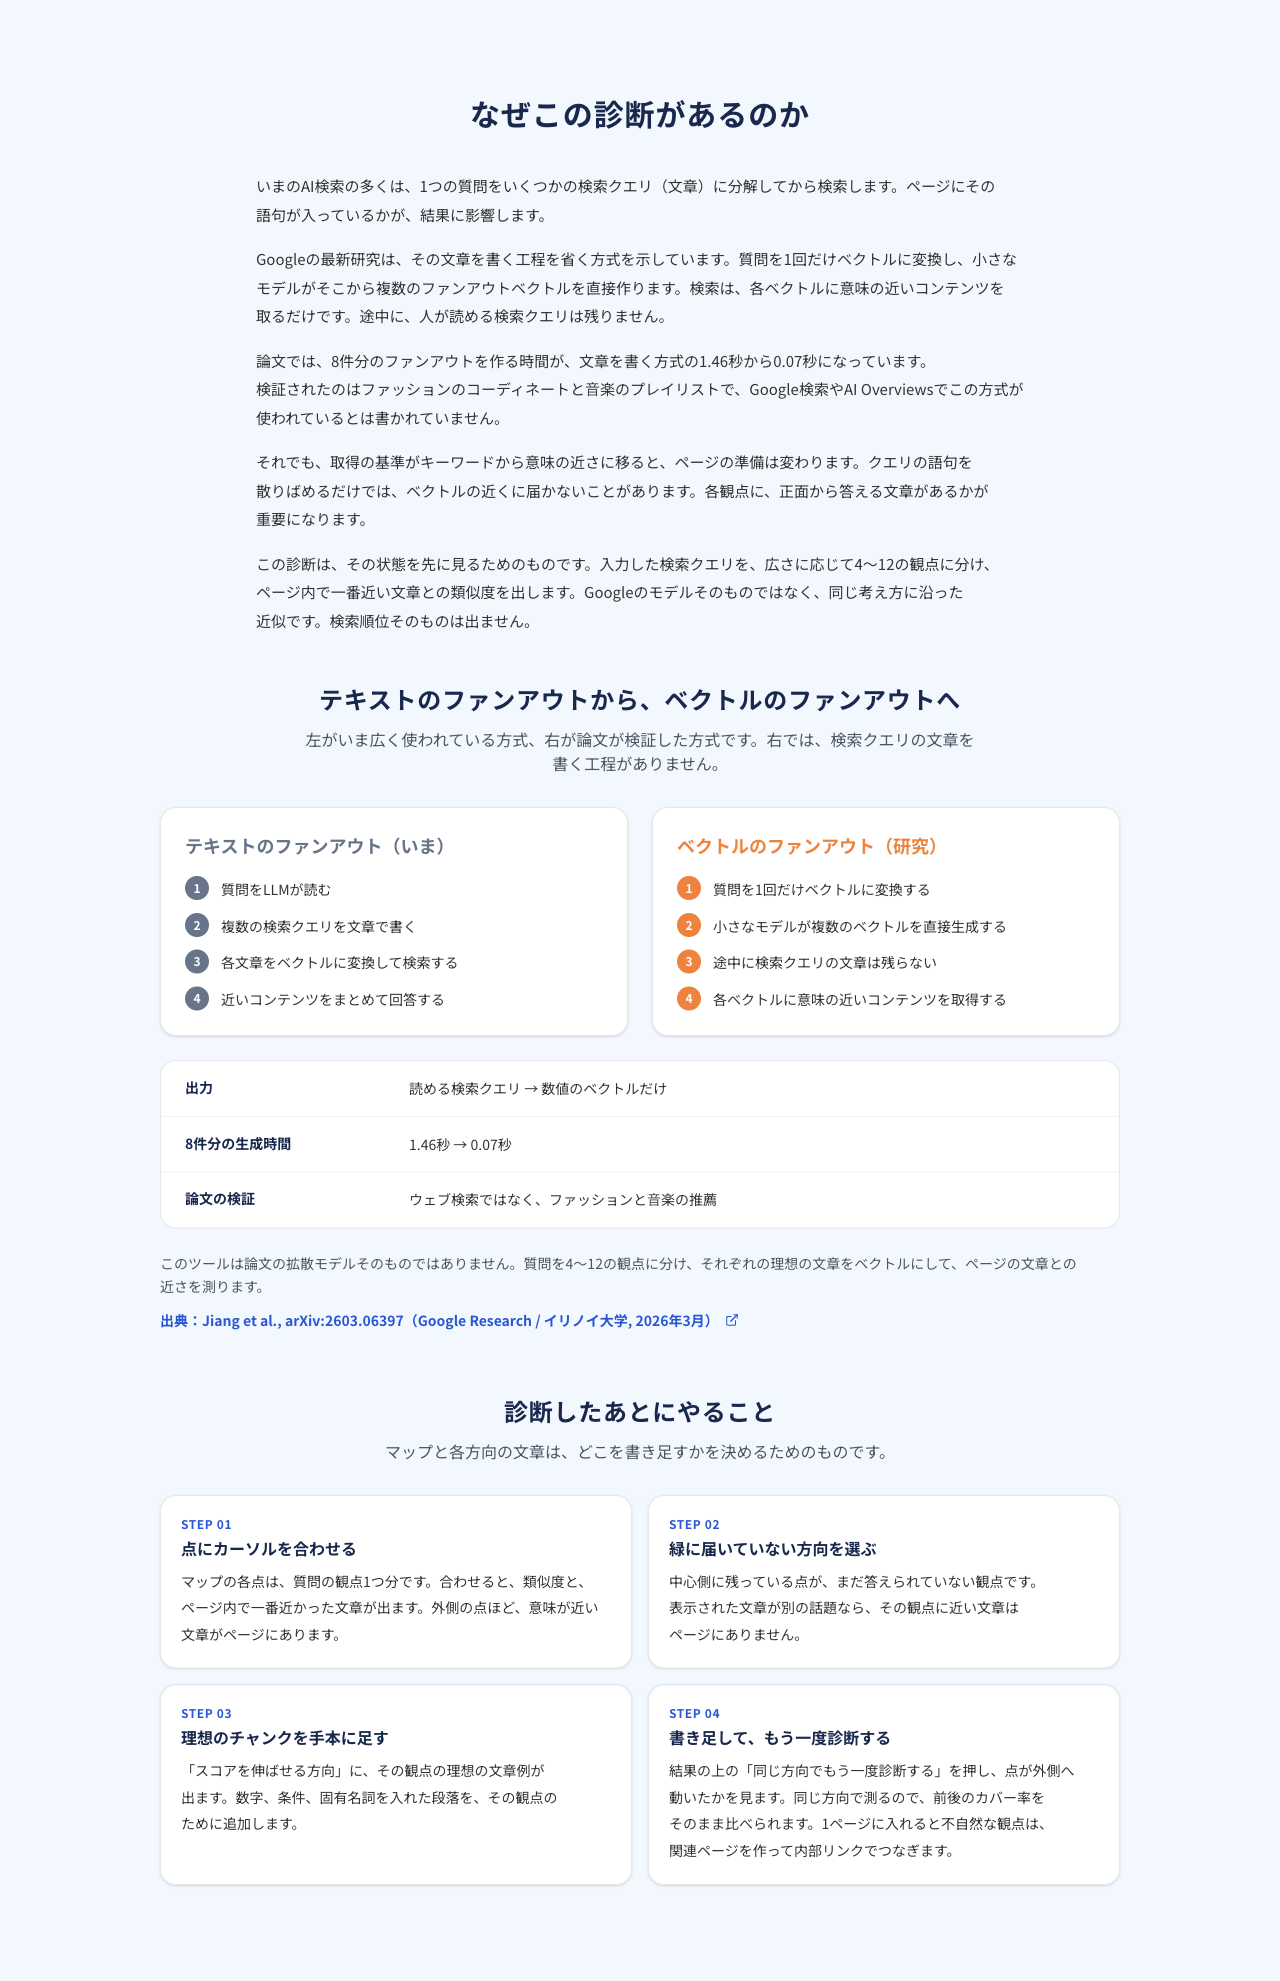
Figure 2 | Differences between text query fan-out and the proposed vector fan-out in the study
The AI Search Content Audit is not a tool that reproduces the diffusion model of the paper itself. It creates 4 to 12 independent perspectives and ideal answer examples from questions, vectorizes them, and measures the semantic proximity to each chunk of your own page, serving as an approximate method for content diagnosis. Therefore, the displayed numbers do not represent the actual citation rates or search rankings by AI.
What you can do with the new free tool
The AI Search Content Audit not only investigates “what the current page answers” but also helps determine improvement areas and compare under the same conditions after improvements.
-
Automatically generates 4 to 12 perspectives based on the breadth of the question
-
Finds the chunk in the page text that is semantically closest for each perspective
-
Visualizes “coverage,” “partial coverage,” and “gaps” in a radar-style coverage map
-
Indicates “ideal chunks” that serve as references for additions and rewrites regarding the lacking directions
-
Allows you to check comparison results by direction and export to CSV (a free release procedure is required for viewing all items and output)
-
Compares Before/After by diagnosing “again in the same direction” after rewriting
How to use it in 3 steps. Start with a question and one page
STEP 1|Enter the question you want your company to be found for
Write a question that customers are likely to ask AI. For example: “What are LLMO countermeasures? Differences from SEO and specific methods.” It is recommended to use non-branded questions at the comparison and consideration stage rather than named questions that include the company name.
STEP 2|Enter the URL of the page that answers that question
Specify an article or service page that directly answers the question, not the homepage. If you enter a URL that is loosely related to the theme you want to search, it will not lead to improvements even if you only look at the numbers.
STEP 3|Read the diagnosis results and choose a direction for improvement
The tool compares the ideal text for each perspective with the text on the page using vectors, summarizing scores, maps, and improvement candidates. The general processing time is about 20 to 40 seconds.
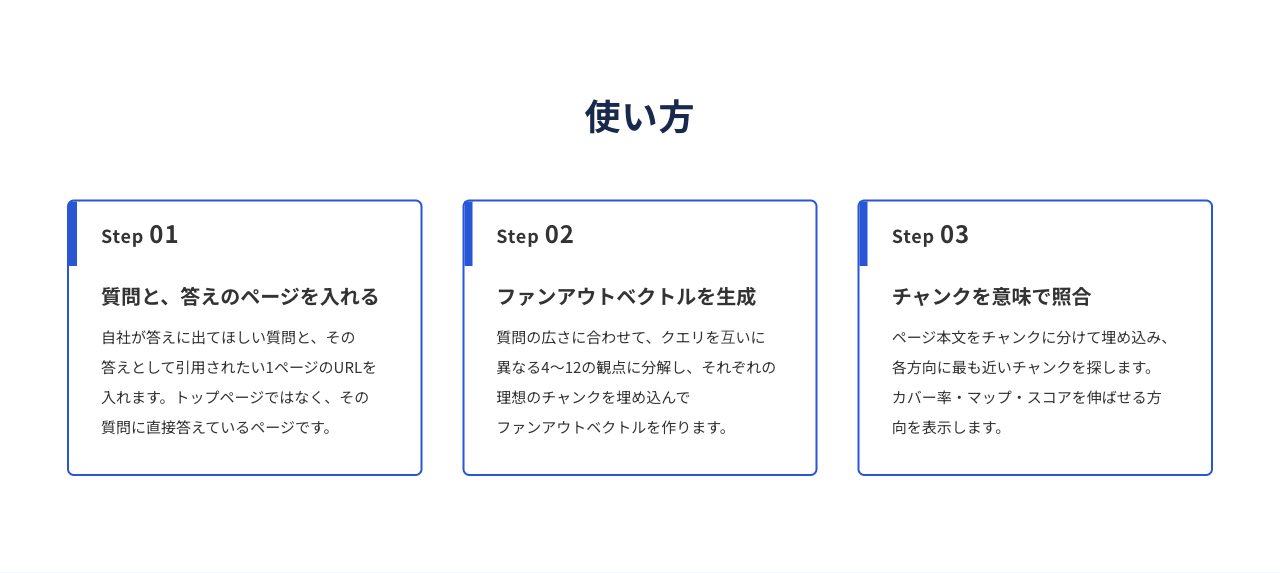
Figure 3 | Basic operation of the tool: Question & URL input → Direction generation → Chunk matching
Diagnosis example: How to read a page with a vector coverage rate of 84 points?
The following is an example of the diagnosis screen for the article “What are LLMO countermeasures? Differences from SEO and specific methods” within umoren.ai. The results were a vector coverage rate of 84/100, covering 3 out of 6 directions, with 0 gaps and an orthogonality of 48/100.
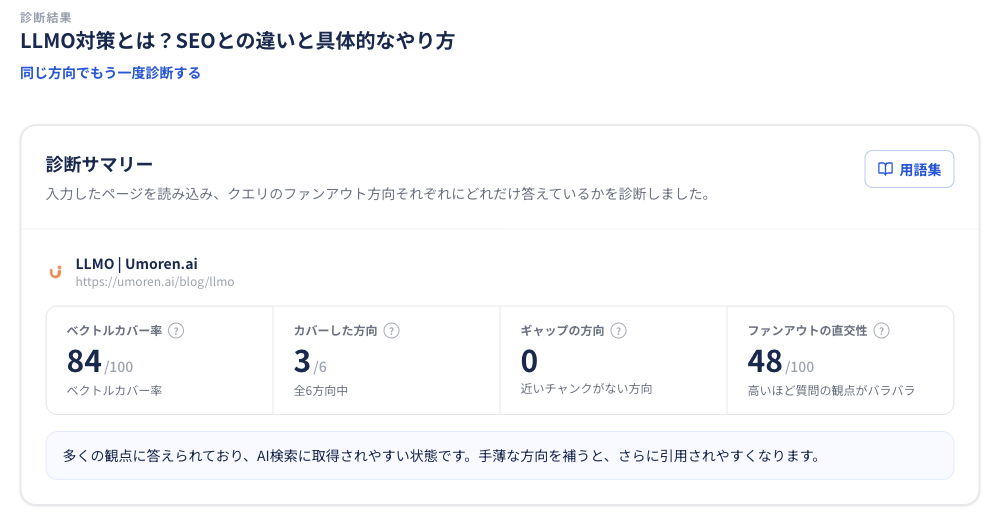
Figure 4 | Diagnosis summary: Coverage rate 84/100, covering 3 out of 6 directions
Just because there are 0 gaps doesn’t mean there’s nothing to fix. In this example, 3 directions are “covered,” while the remaining 3 directions are “partially covered.” It indicates that while some aspects are answered partially, there are perspectives that could be made more specific.
① Coverage map: Finding directions that remain toward the center
Each axis of the map indicates the perspectives of the question, and the further the blue points are outward, the more semantically similar sentences exist on the page. The green band indicates coverage, the orange band indicates partial coverage, and the inner area indicates gaps.
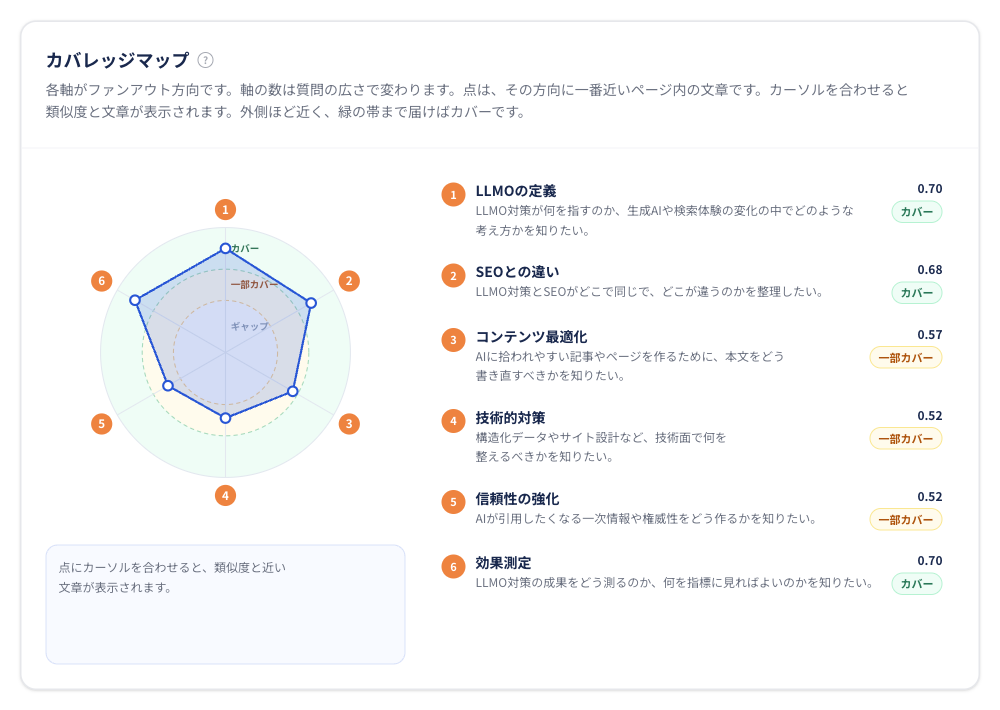
Figure 5 | Coverage map: Check six perspectives in a radar chart
Moreover, hovering over a point will display the actual sentence that is closest to that direction. It is important to check whether the selected text, even if the score is high, is aligned with the intent by reviewing both the score and the text.
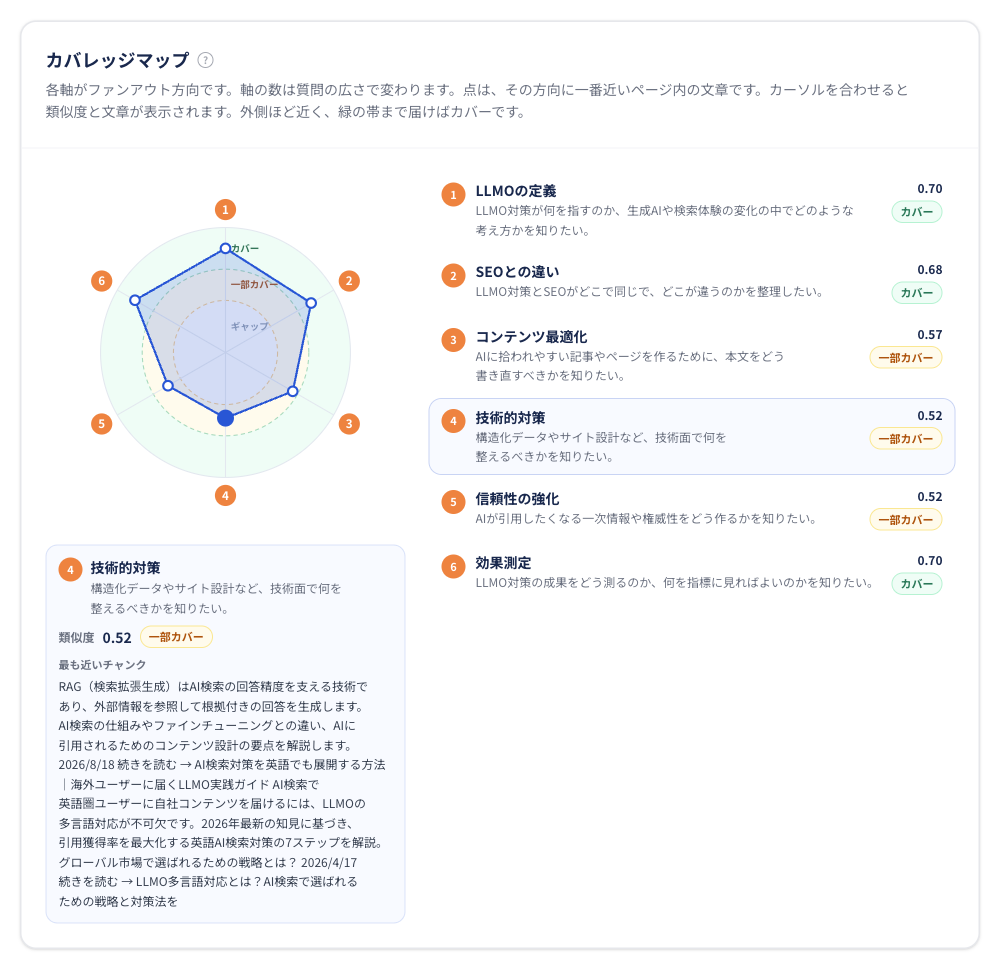
Figure 6 | Selecting a point on the map shows the closest text chunk and similarity
② List by fan-out direction: Organizing what is lacking
The list includes perspectives broken down from the question such as “definition of LLMO,” “differences from SEO,” “content optimization,” “technical measures,” “enhancing reliability,” and “effect measurement.” You can consider which parts to prioritize for additional content at the heading level.
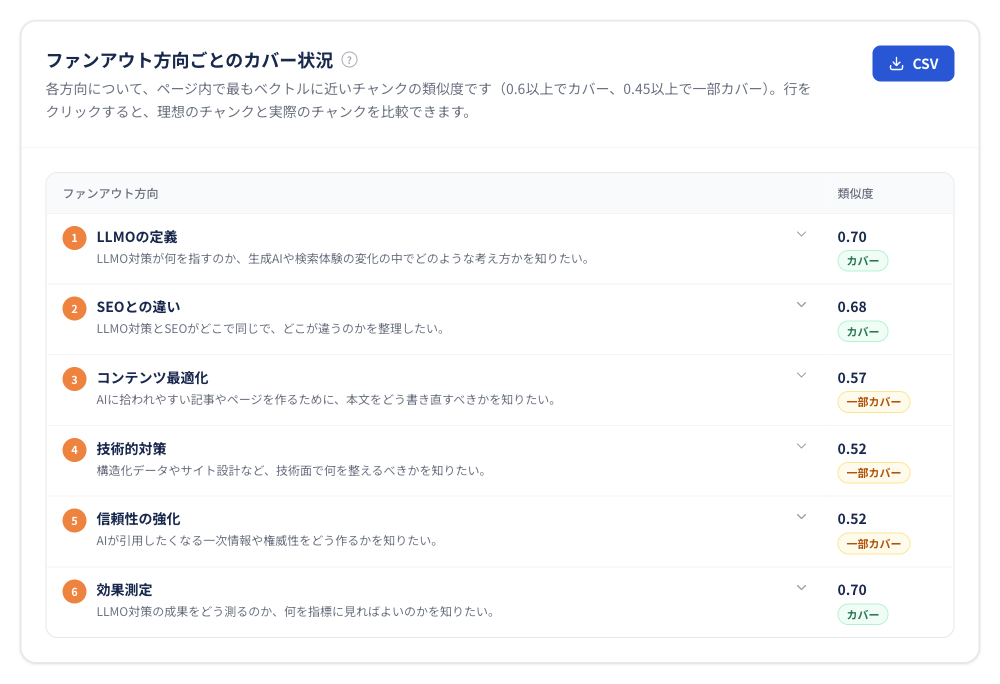
Figure 7 | Coverage status by direction: Displaying similarity and status for each perspective
When you open a row, the ideal chunk appears on the left, and the closest chunk on the page appears on the right. By observing the differences between the two, you can identify improvement points such as “not directly answering the intent” or “missing necessary conditions” even for the same topic.
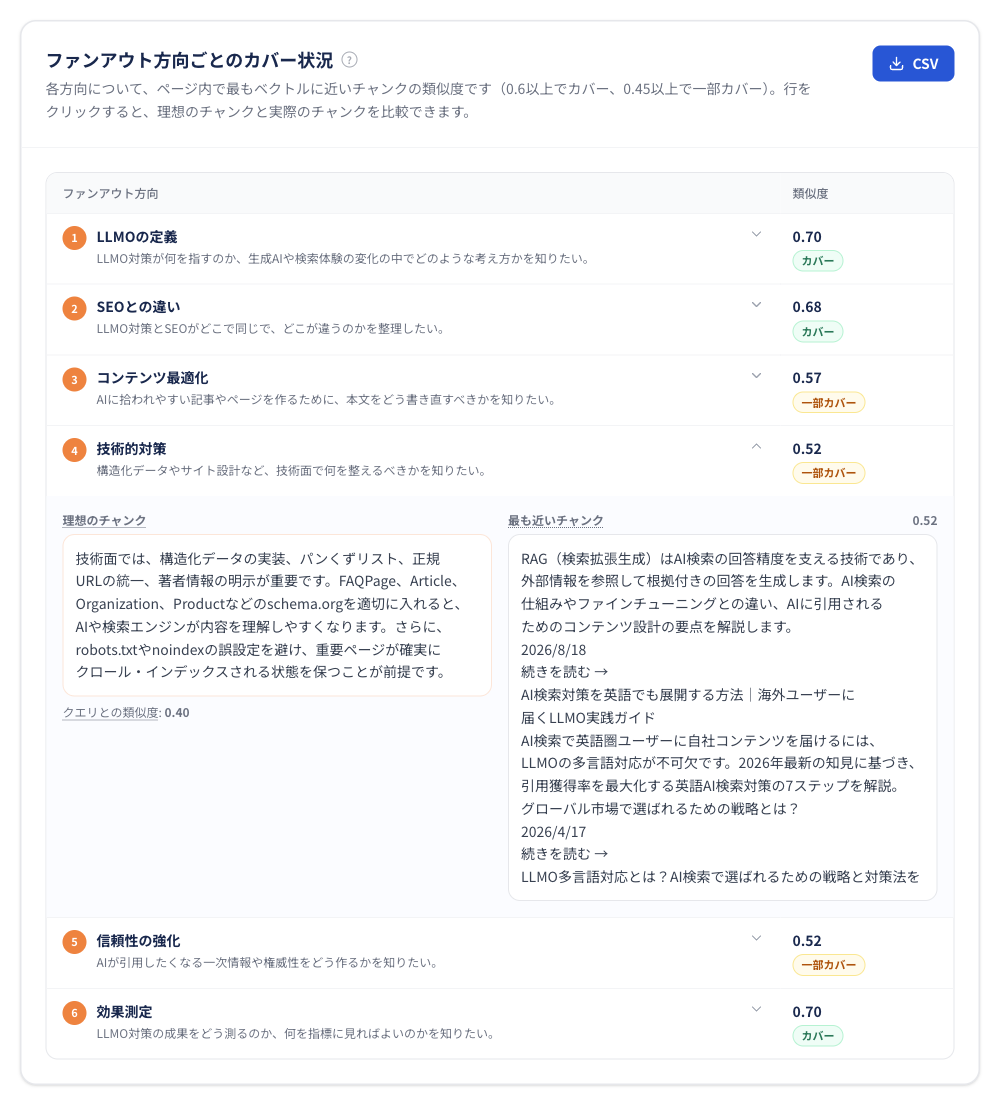
Figure 8 | Comparing 'ideal chunks' and 'actual chunks' side by side
③ Deciding content for additions from “directions where scores can be improved”
Directions with partial coverage or gaps are listed as improvement candidates. In the example screen, “technical measures,” “enhancing reliability,” and “content optimization” are shown, with ideal text examples displayed for each direction.
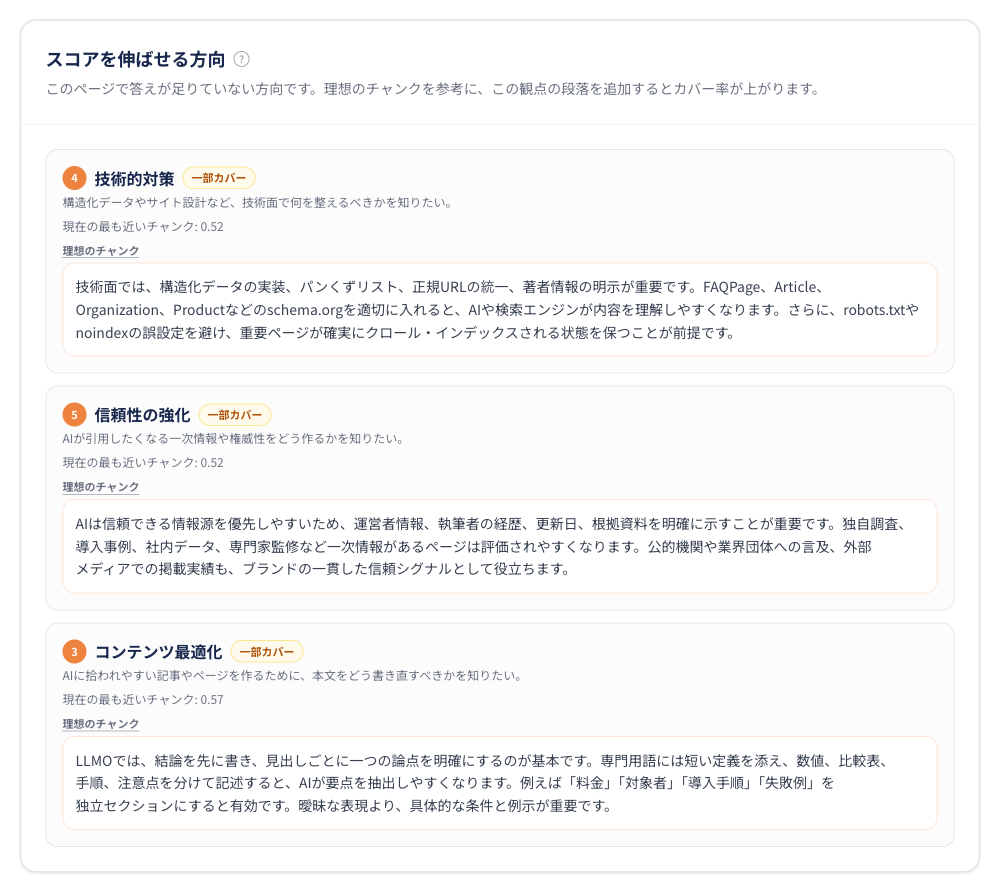
Figure 9 | 'Directions where scores can be improved': Listing lacking points and ideal chunks
The ideal chunks are not verified texts or ready-to-paste drafts. They are reference examples that show the types of necessary information and text structure. Please ensure accuracy based on primary sources or your company’s information before publishing any numerical data, achievements, or technical specifications.
Meaning of the scores: 0.60 and above is “covered,” 0.45 and above is “partially covered”
|
Status |
Similarity |
Judgment during editing |
|
Covered |
0.60 and above |
There is text close in meaning to that perspective. Specific examples, conditions, and grounds can be further strengthened |
|
Partially Covered |
0.45 and above but below 0.60 |
There are related descriptions, but I want to supplement direct answers to the question |
|
Gap |
Below 0.45 |
No text close in meaning to that perspective can be found. Consider adding new paragraphs or related pages |
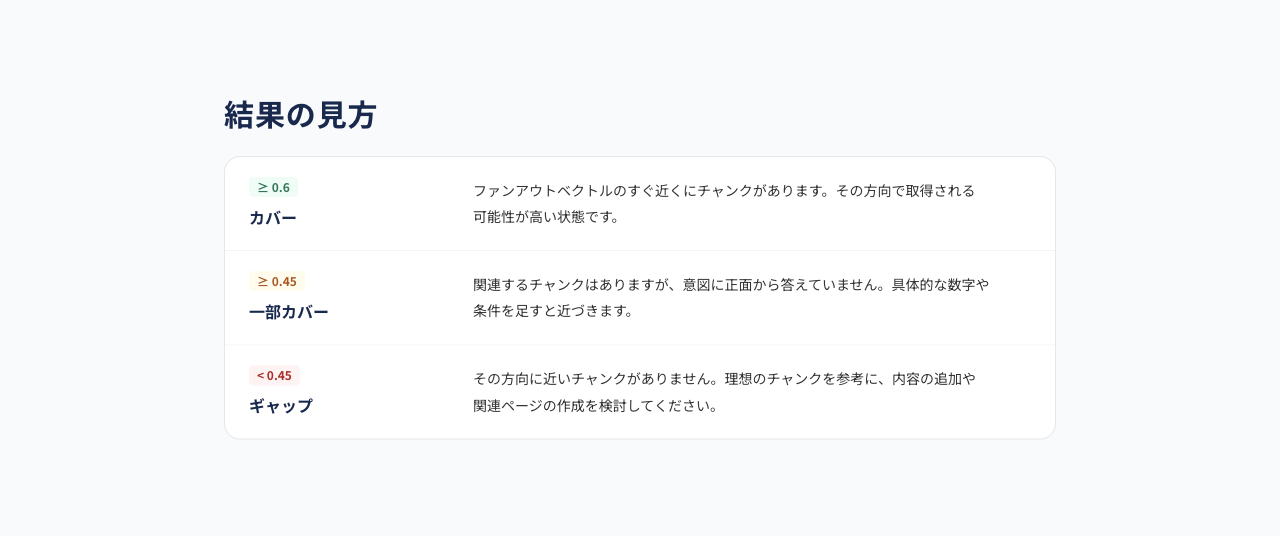
Figure 10 | Criteria for determining coverage/partial coverage/gap
The vector coverage rate is an indicator that converts the similarity of the closest chunk for each direction to a scale of 0 to 100 and averages it across all directions. It is not merely the “percentage of directions covered.” Additionally, it is not suitable for simple comparisons of scores between questions with different numbers of directions.
Specific improvement steps: Diagnosis → Rewrite → Re-diagnosis in the same direction
The purpose of the diagnosis is not just to look at the scores but to determine the editing content. First, select one direction with a low score that is also important for business, and try creating a section that directly answers that perspective.
-
Select one perspective for improvement
Example: If “technical measures” is partially covered, check if the explanation of technical requirements is not too abstract.
-
Add a corresponding heading and a paragraph that directly answers
Example: Set H3 “Items to Check for Technical Measures of LLMO,” and explain the crawlability of the site, HTML display of important pages, compliance of structured data, and consistency of URLs one by one. Adding your implementation examples and verification methods will be more useful than just listing terms.
-
Verify sources, conditions, and recency before publishing
Avoid fictional numbers or unsupported claims of “will definitely be quoted,” and add actual measurements, case studies, target conditions, and update dates as needed.
-
Compare Before/After by diagnosing “again in the same direction”
Since the automatically generated perspectives may vary slightly each time, using the function to compare in the same direction is appropriate. In the re-diagnosis, the previous perspectives are fixed while matching the new page text, allowing you to check changes in coverage rates.
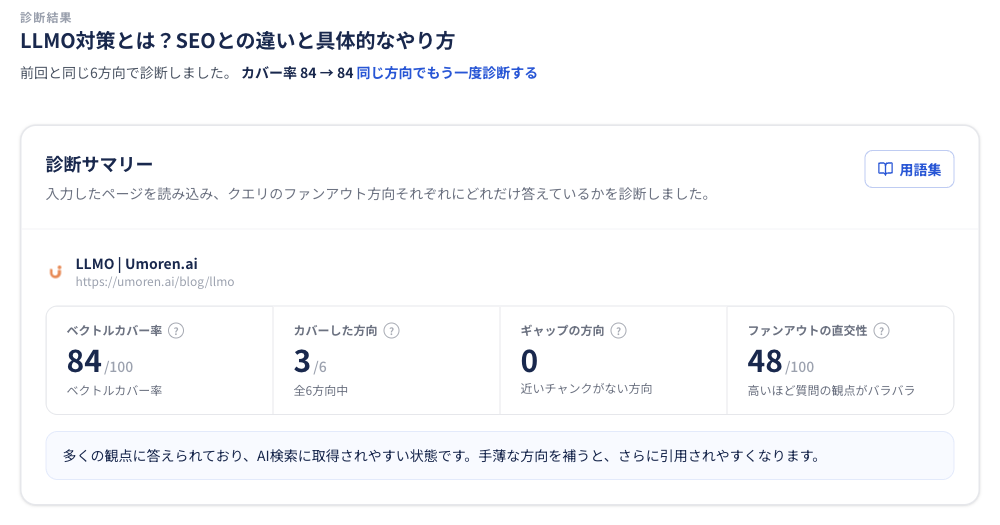
Figure 11 | Re-diagnosing in the same direction allows you to check Before/After coverage rates
|
Points for evaluating improvements Even if the coverage rate increases after adding text, it does not guarantee an increase in actual citations or mentions in ChatGPT/Gemini. It is important to verify semantic fit improvements and actual exposure in AI responses as separate indicators. |
Should everything be crammed into one page? The concept of “orthogonality” and internal linking
“Orthogonality of fan-out” is an indicator of how different the generated perspectives are from each other. The higher it is, the more likely it is that multiple independent points are included in the question. For example, if you forcefully cram “pricing,” “technical specifications,” “implementation steps,” “reviews,” and “industry-specific examples” into one page, all information may become superficial.
In such cases, it is effective to design the core article to directly answer the question while linking detailed supplements to separate pages via internal links. For example, technical measures can link to an article explaining the mechanisms of RAG and AI search, and understanding the search process can connect to an article introducing examples of query fan-out, making it easier for readers to delve into the information they need.
How is this different from ChatGPT and Gemini's QFO analysis tools?
umoren.ai also offers ChatGPT Query Fan-Out Analysis and Gemini Query Fan-Out Analysis for free. These tools are for observing what search queries AI has executed and the search process. In contrast, the AI Search Content Audit measures how semantically close the text of a specified single page is to each perspective of the question.
|
Tool |
Main Question |
Suitable Uses |
|
ChatGPT QFO Analysis |
What search and evaluation processes did the AI go through to answer? |
Understanding execution queries, sources, and evidence/quotation processes |
|
Gemini QFO Analysis |
What did Gemini actually search for? |
Observing search intent and sub-queries |
|
AI Search Content Audit |
What perspectives are lacking in your company’s page? |
Chunk optimization, prioritizing rewrites, Before/After comparison |
By understanding information retrieval in actual AI searches, you can organize content with this tool. Combining these two approaches allows you to improve “perspectives that are searched for” and “perspectives that can be answered on the page” separately.
Frequently Asked Questions (FAQ)
Q. Is it really free to use?
Yes. You can perform basic audits even as a guest. To view all directions in the results, check all improvement candidates, and export to CSV, you need to register for a free account or complete a one-time release with company information. Please check the tool screen for the latest usage conditions.
Q. How many fan-out directions are generated?
Depending on the breadth of the question, it ranges from 4 to 12 directions. For narrow questions, it is about 4 to 5, for general explanations or comparisons it is about 6 to 8, and for broad questions that include multiple conditions such as budget, region, or use, it is about 9 to 12 directions. The more directions there are, the harder it becomes to answer everything on a single page.
Q. Can you tell me the probability of being quoted by AI or the Google ranking?
No. The numbers from this tool are indicators of the semantic fit of the content based on unique vector matching. They do not represent actual rankings or citation rates in Google Search, AI Overviews, or ChatGPT.
Q. Why can’t the page be loaded?
There may be access restrictions for bots, configurations that render the text only in JavaScript, or other files that are not HTML. During diagnosis, the tool primarily extracts the main text of articles or service pages, excluding navigation and footer from the evaluation.
Q. Can I compare scores with competitor sites?
This free diagnosis is designed to check the content of one page per session. If you want to consider the AI citation status of competitors and page-level improvement policies, please utilize umoren.ai's AI search strategy consulting.
Conclusion | Moving from “Intuitive Additions” to “Perspective-Based Improvements” for AI Search Strategies
With LLMO, simply increasing the number of articles is not the only solution. By breaking down user questions, you can see the perspectives that existing articles adequately answer and those that are lacking. The “AI Search Content Audit” launched this time is a free tool to visualize the proximity of text by perspective and the direction of rewrites from the combination of questions × URLs.
First, select one question you want your company to be found for and diagnose the one page that is closest to that question. Once you understand the improvement candidates, you can immediately start updating your published content.
|
Free tool here AI Search Content Audit | Visualizes the correspondence between 4 to 12 perspectives of questions and the text on the page |
▶ Try the AI Search Content Audit for free
If you want to see “why you are less likely to be quoted than competitors” or “want to create an improvement plan with your team,” please consult us through free consultation reservation. Other diagnostic tools are listed in the umoren.ai free tools list.
See How AI Search Sees Your Company
Request a free current-state analysis report, delivered within 24 hours
Latest Articles
What are the expected effects of LLMO in owned media? Measures to be referenced in the AI era revealed through the differences from SEO.
【Major Update】ChatGPT Query Fan-Out Analysis Tool Evolves | Visualization from Pre-Search Assumptions to Brand Diagnosis